Case Study
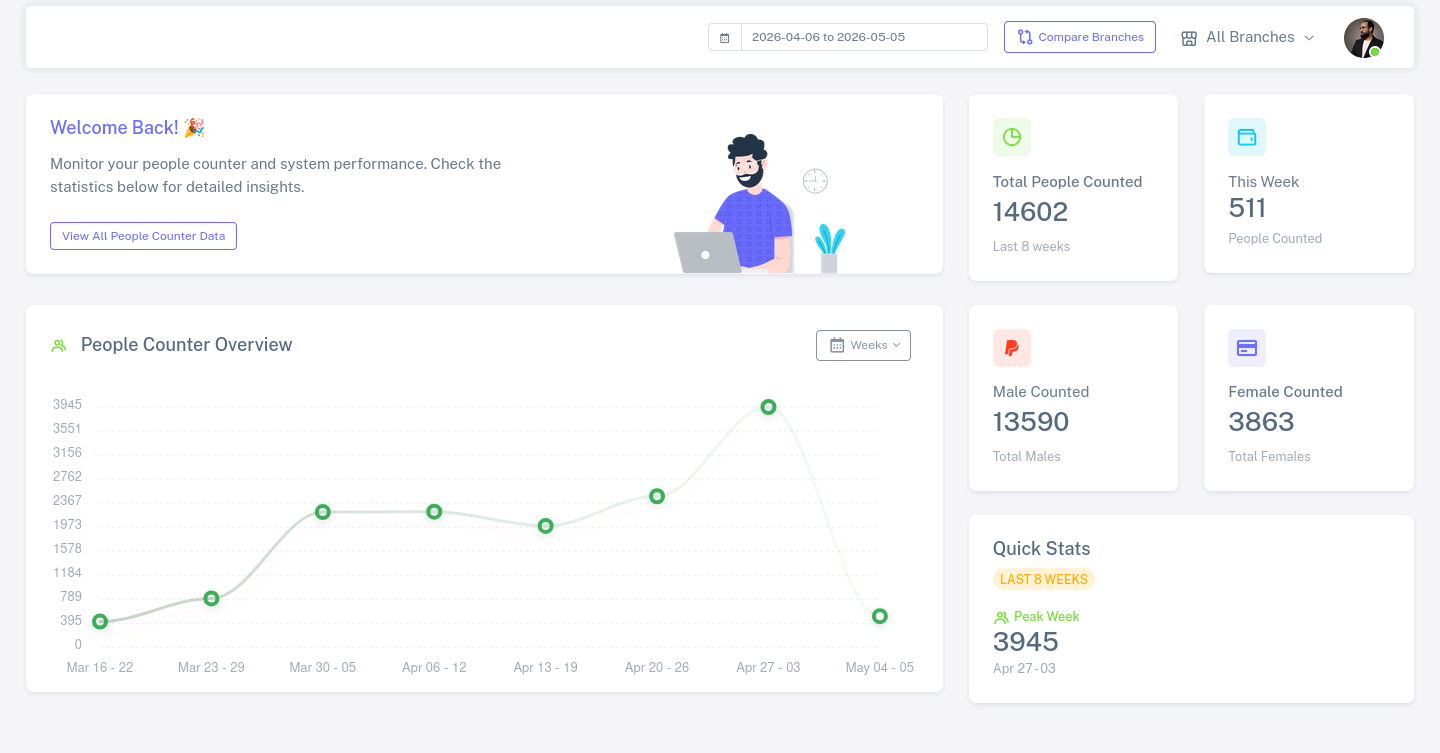
VisionIQ Analytics Dashboard
People counting and analytics dashboard with trends, statistics, and insights.
Problem
Teams lacked an analytics-first dashboard to understand people traffic trends and branch-level behavioral patterns in real time.
Solution
Built an analytics dashboard that turns counting streams into clear KPIs, trend lines, and decision-ready summaries.
Architecture
API Structure
Analytics endpoints expose period-based counts, trend series, and branch segmentation through dedicated reporting services.
Data Flow
Counting events stream into time-series aggregations, then populate dashboard cards and charts through precomputed views.
Backend Decisions
Adopted read-optimized data pipelines and resilient aggregation jobs to keep charts accurate and responsive.
Challenges
Keeping high-volume counting data queryable for live dashboards without degrading reliability.
Technical Decisions
Used staged aggregation and caching strategies to serve high-frequency dashboard requests consistently.
Impact
Enabled faster branch-level analysis and improved visibility into traffic behavior across operations.